The Papercrane Blog
Product updates, dashboard playbooks, and notes on building with your data.
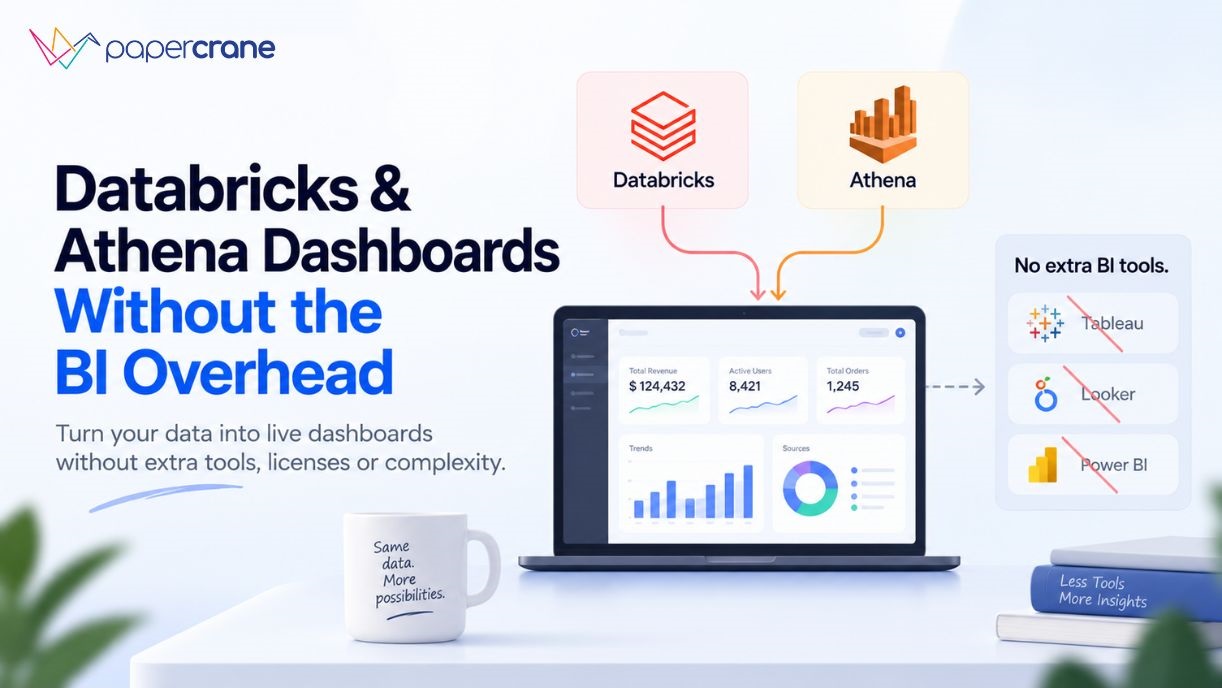
Databricks & Athena Dashboards Without the BI Overhead
You’ve already done the hard part. The data is ingested. The pipelines are running. Your Databricks lakehouse is humming, or your Athena queries are firing against S3 on demand. And then someone in a meeting asks for a dashboard, and suddenly you’re being quoted $75 per user per month for Tableau, or spending a Friday […]
September 2, 2026
·
Tim Liu
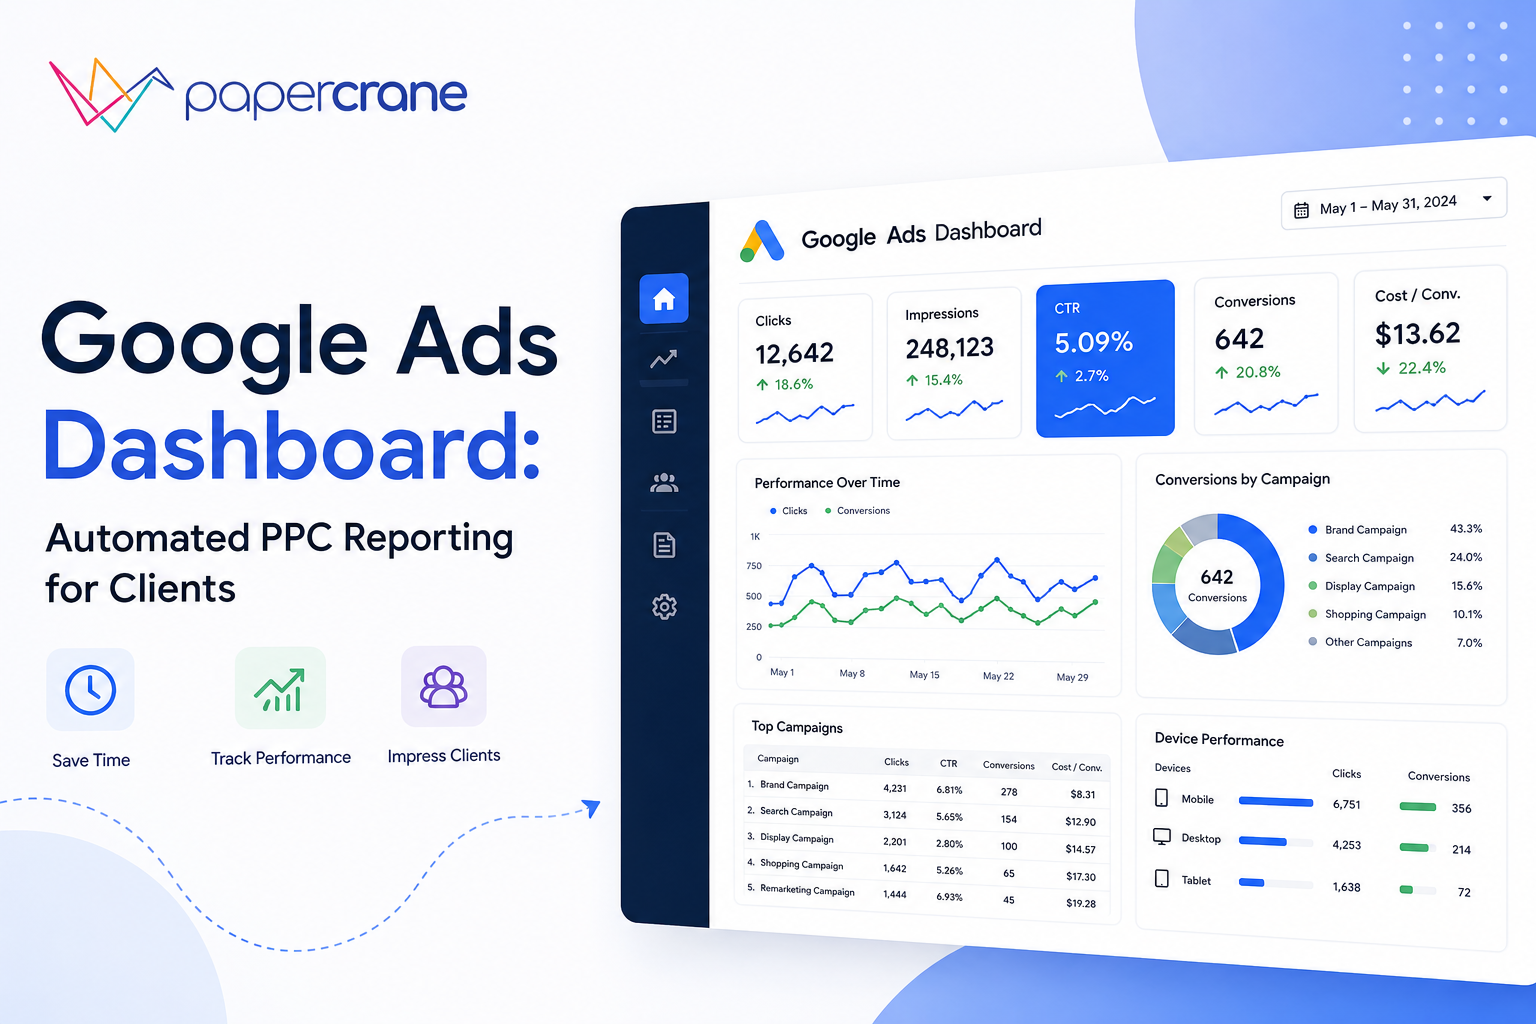
Google Ads Dashboard: Automated PPC Reporting for Clients
A client messages you at 4:47pm on a Friday: “Why did conversions drop this week?” You have the answer somewhere, across three MCC accounts and a spreadsheet you last updated on Tuesday. By the time you’ve exported CSVs and rebuilt the chart, the client has already drawn their own conclusion. This is the actual problem […]
August 31, 2026
·
Tim Liu
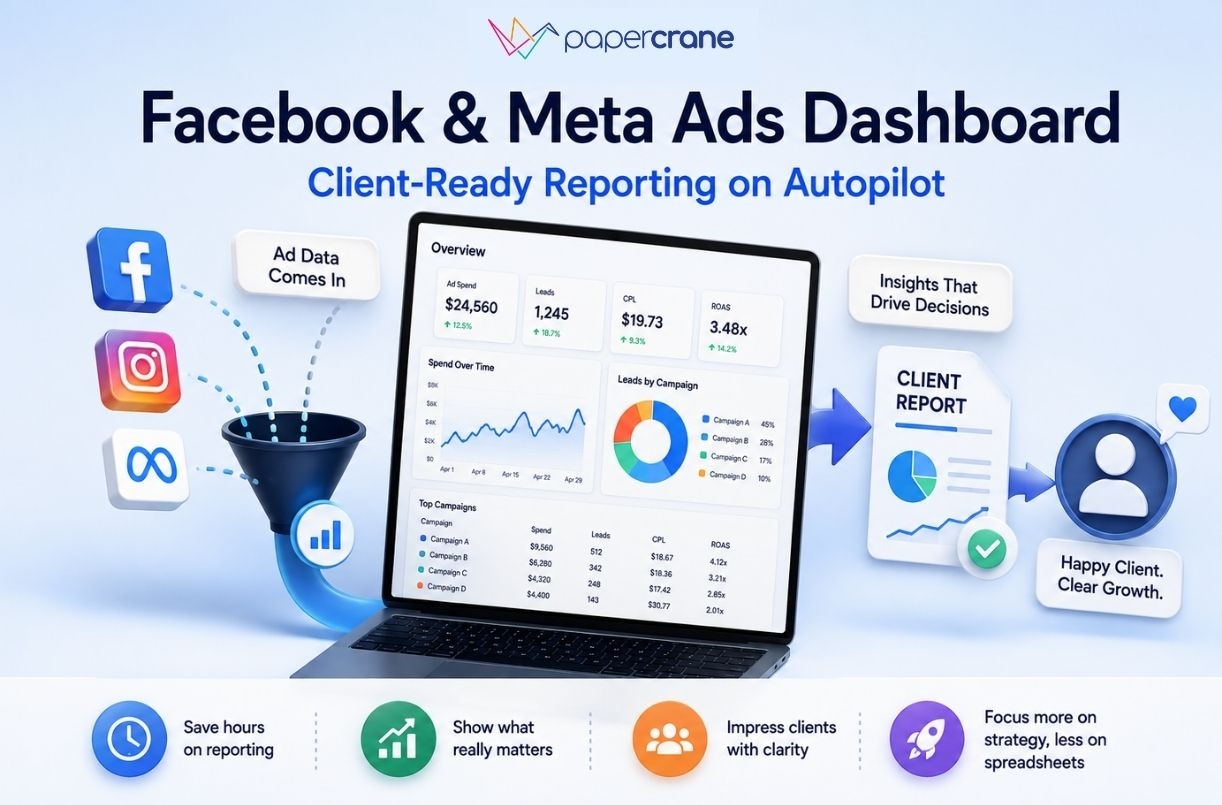
Facebook & Meta Ads Dashboard: Client-Ready Reporting on Autopilot
Your Meta Ads campaigns are running. The data is there. The client still wants answers. Which campaigns generated the best leads? Which ads drove revenue? Why did CPL increase? What changed from last month? Where should the budget move next? A Facebook Ads dashboard should help answer those questions without turning every client report into […]
August 30, 2026
·
Tim Liu
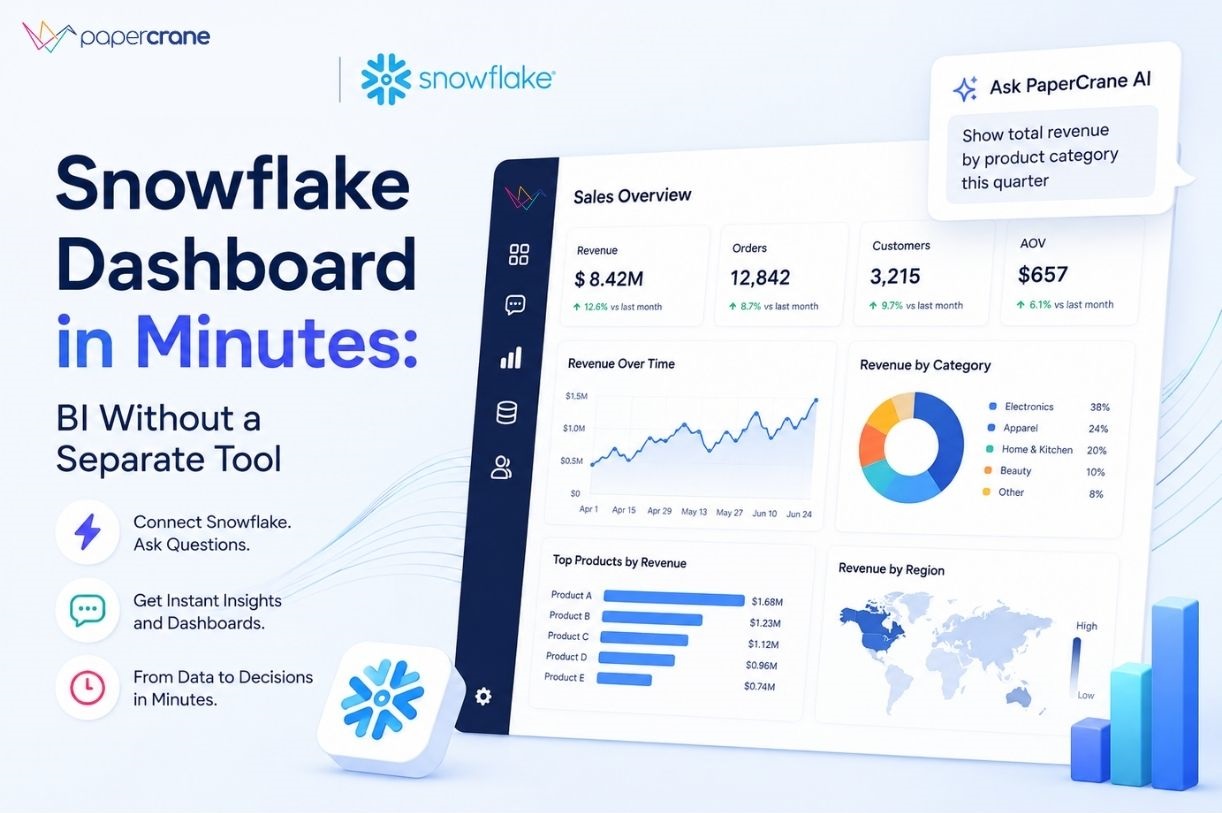
Snowflake Dashboard in Minutes: BI Without a Separate Tool
You built the data warehouse. You migrated to Snowflake, modeled your tables, and finally have clean, reliable data in one place. The hard part is supposed to be over. But when your CEO asks for a revenue chart, someone opens a ticket for the analyst. When your marketing lead wants to see this week’s campaign […]
August 29, 2026
·
Tim Liu
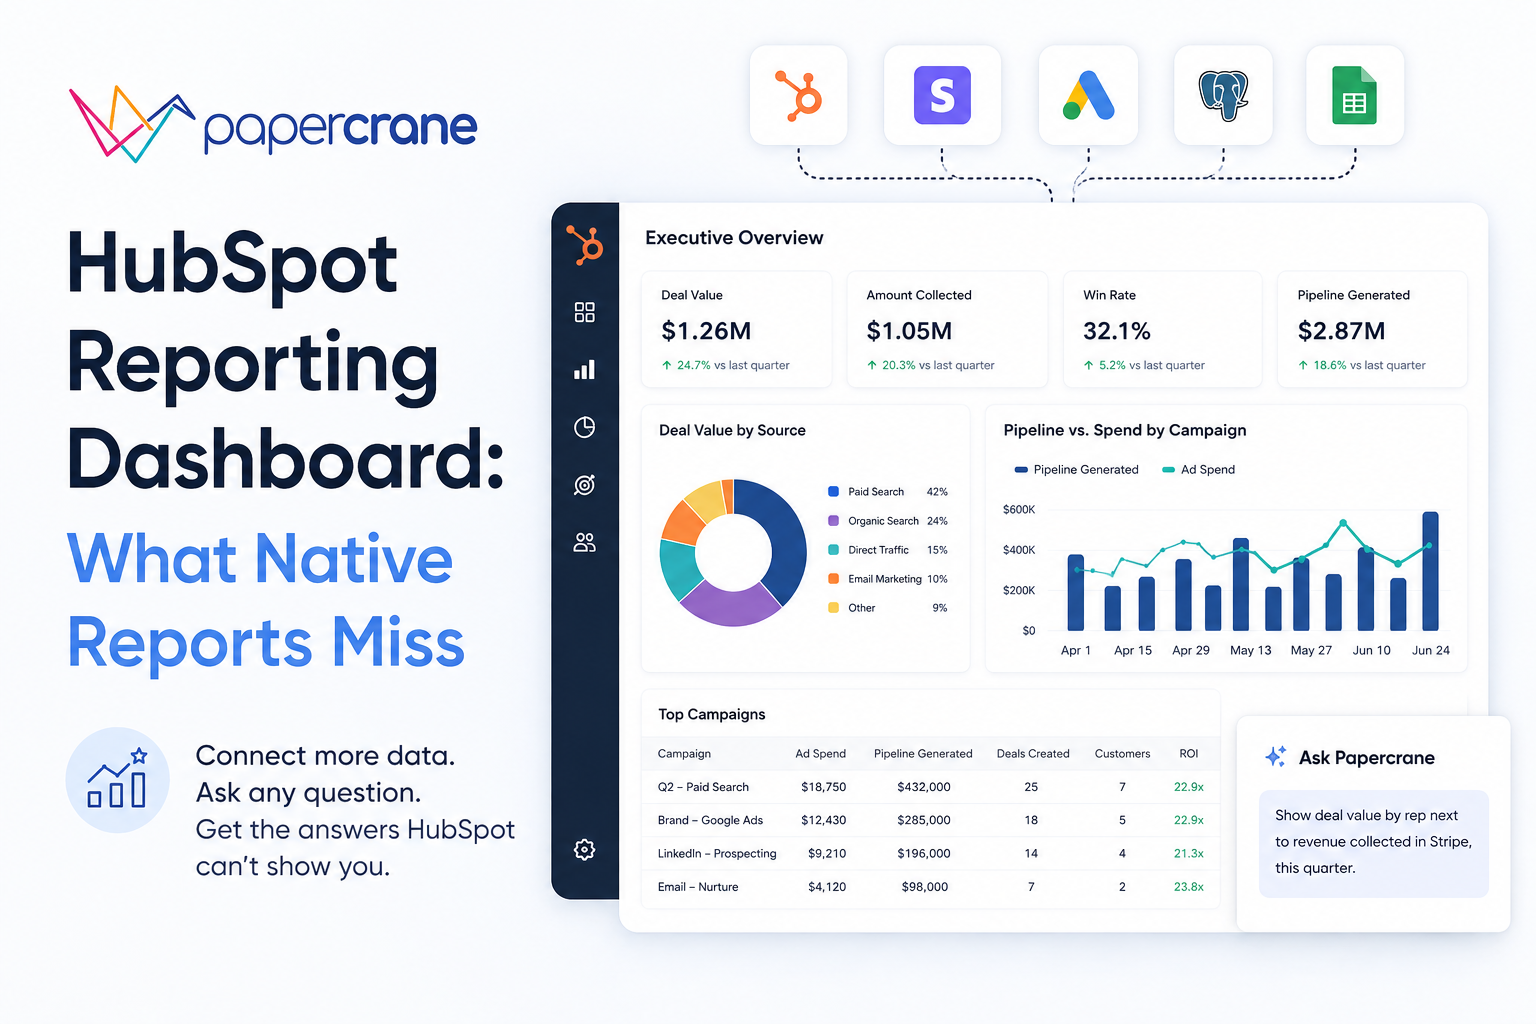
HubSpot Reporting Dashboard: What Native Reports Miss
You built the report. Then someone asked a question it can’t answer, because the data lives in two objects HubSpot won’t let you join, or in a tool HubSpot has never heard of. This is the point where most teams start searching for “hubspot reporting dashboard,” and it’s usually not curiosity. It’s a specific report […]
August 28, 2026
·
Tim Liu
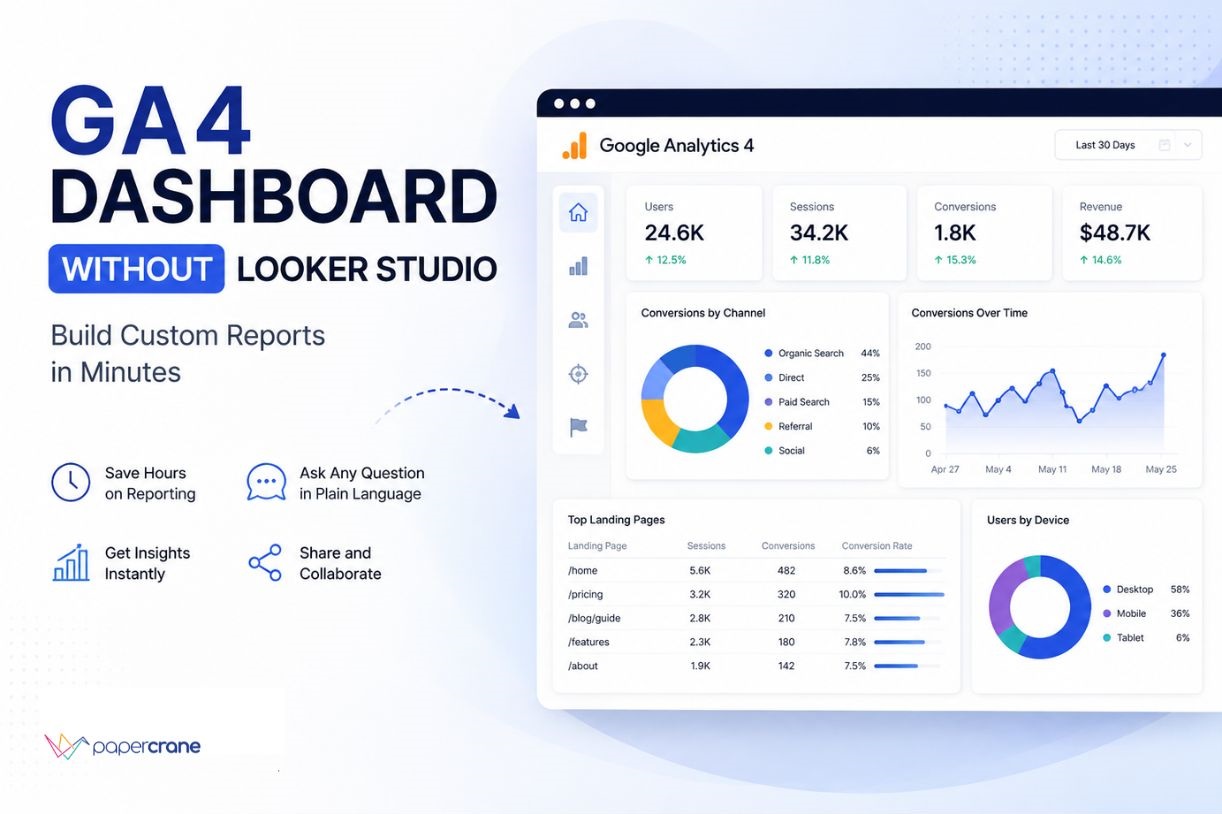
GA4 Dashboard: Custom Reports Without Looker Studio
You already have the data in Google Analytics 4. The problem is getting the exact answer you need without spending another 20 minutes clicking through reports, changing dimensions, adding filters, or building another dashboard. A GA4 dashboard should reduce that work, not become another reporting project. Papercrane gives you a different workflow. Connect GA4, describe […]
August 26, 2026
·
Tim Liu
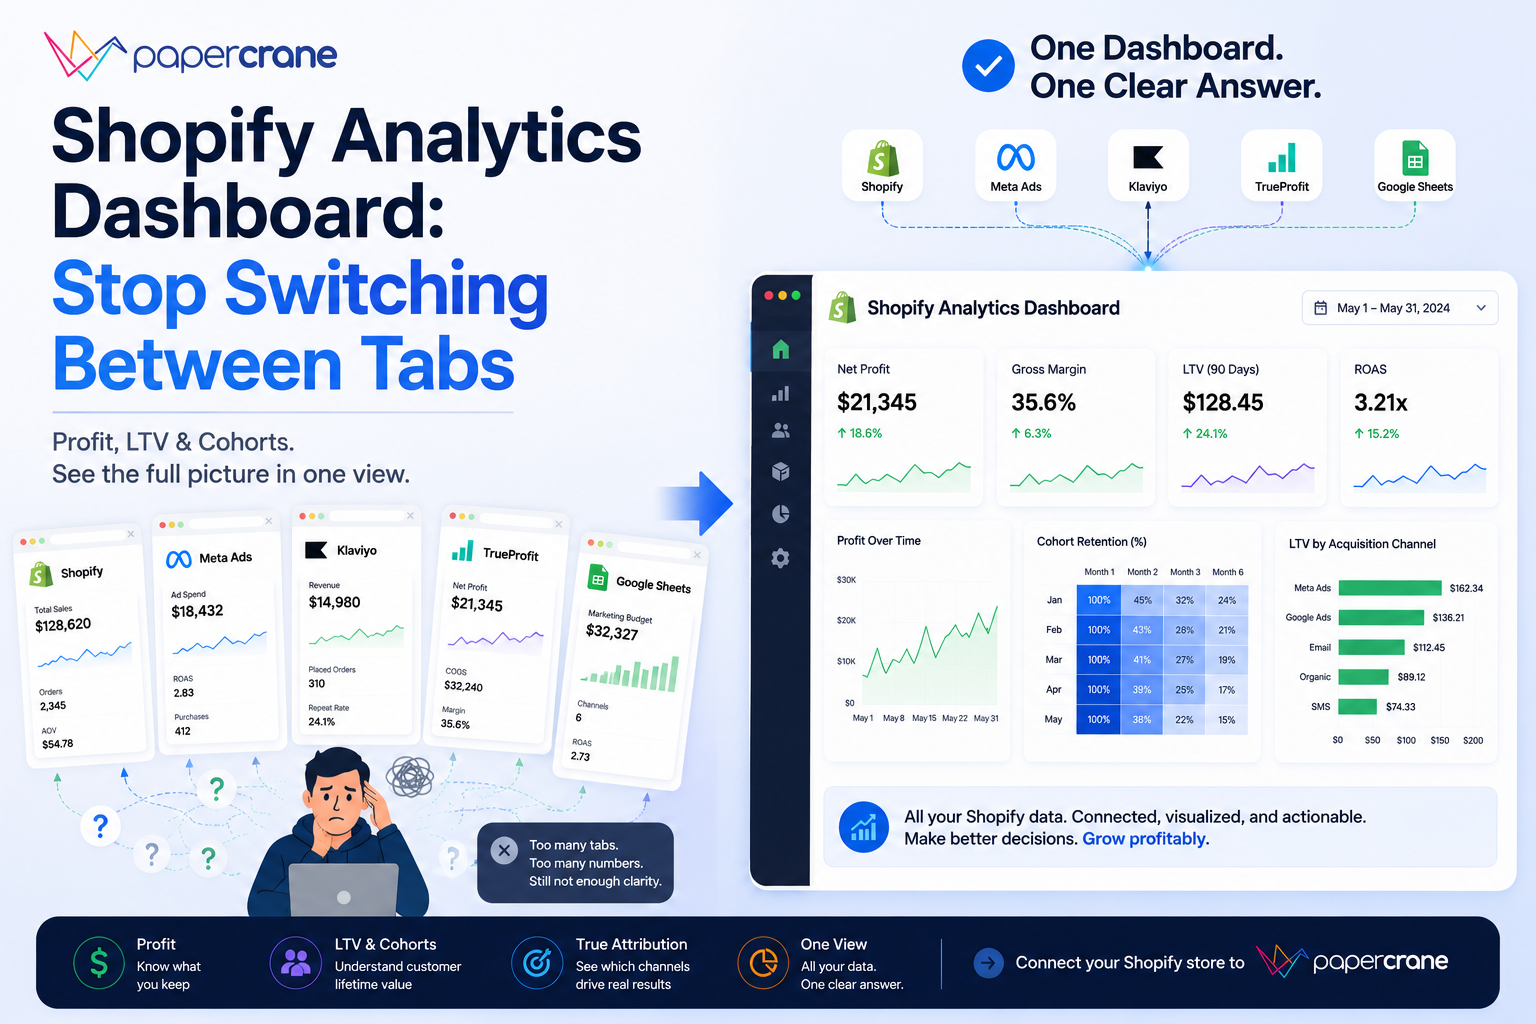
Shopify Analytics Dashboard: Stop Switching Between Tabs
You open your Shopify analytics dashboard to track your store’s sales, traffic, and orders to get a read on last week. Revenue looks decent. You feel cautiously okay. Then you open Meta Ads Manager to check your ad performance. Then Klaviyo to see what email brought in. Then your profit tracking app. Forty-five minutes later, […]
August 24, 2026
·
Tim Liu
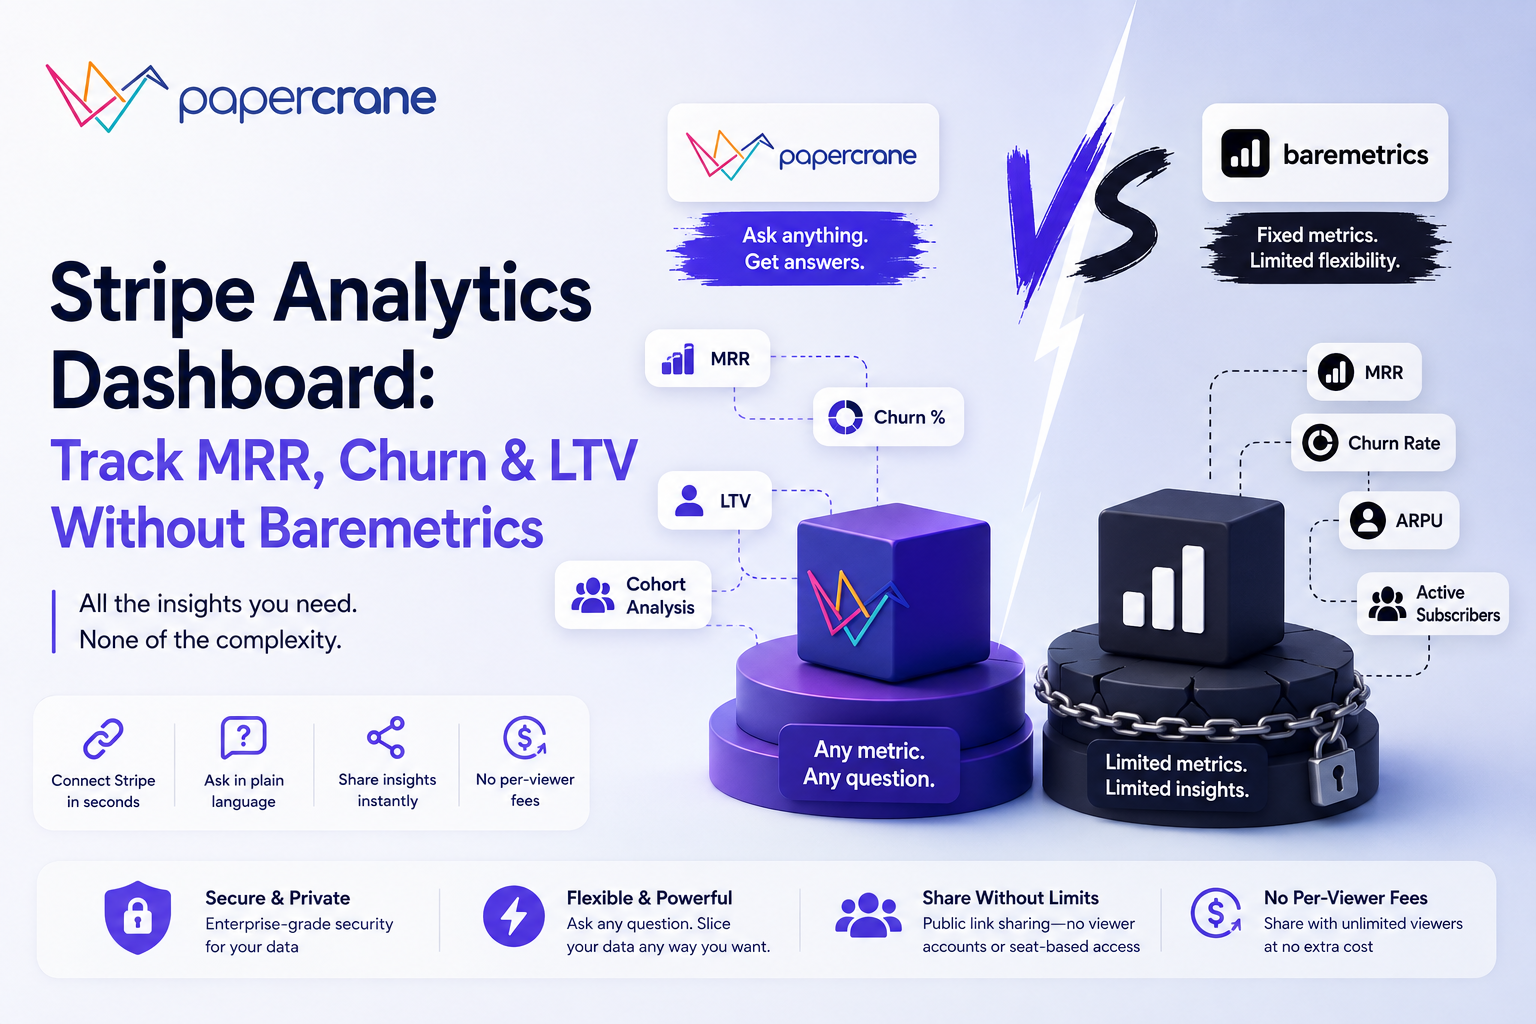
Stripe Analytics Dashboard: Track MRR, Churn & LTV Without Baremetrics
It’s Sunday night and you’re staring at your Stripe dashboard trying to figure out if you actually grew this month, or if you’re fooling yourself. A few customers churned, someone downgraded, and you’re not sure the new signups covered the loss. So you open a spreadsheet and start pulling numbers by hand, an hour later, […]
August 19, 2026
·
Tim Liu
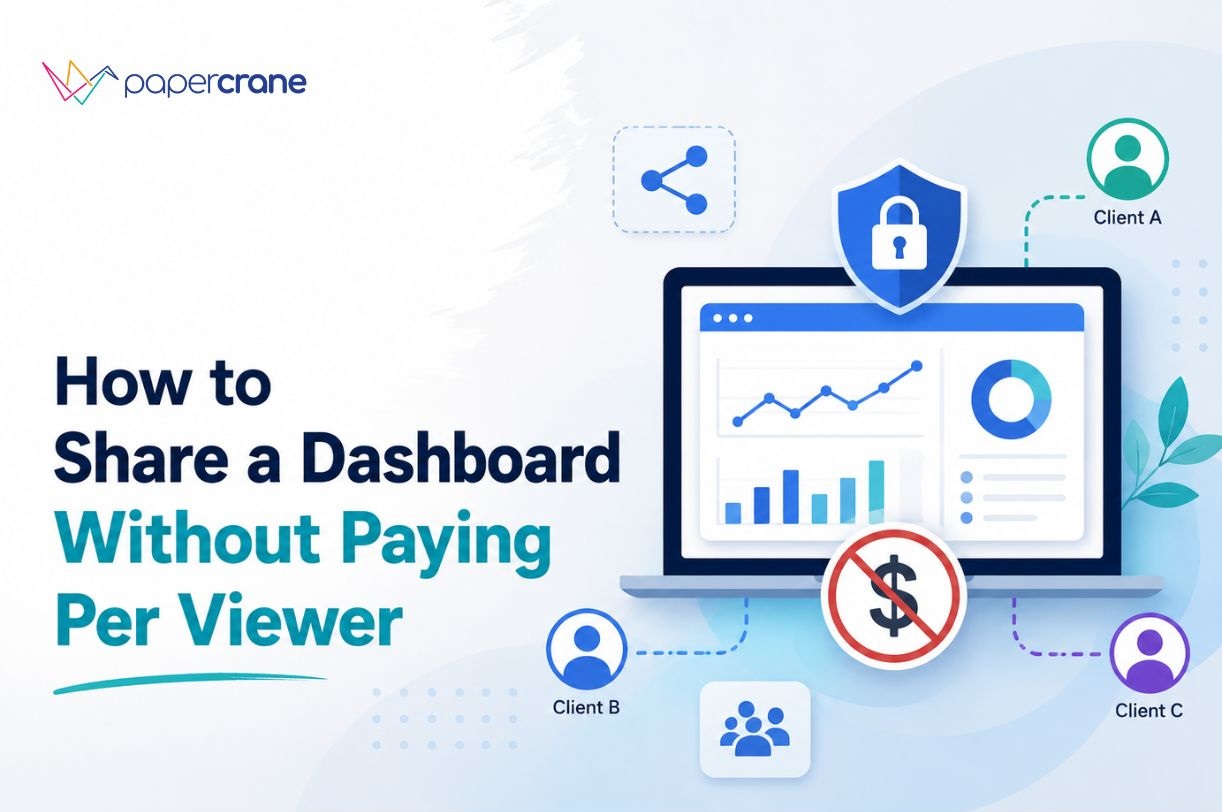
How to Share a Dashboard Without Paying Per Viewer
You build the dashboard once. Then the client asks you to give access to the marketing manager, CEO, sales director, and finance team. Suddenly, “share the dashboard” becomes a licensing question. Who needs access? Does every viewer need an account? Does every viewer need a paid license? What happens when 10 viewers become 100? How […]
August 14, 2026
·
Tim Liu
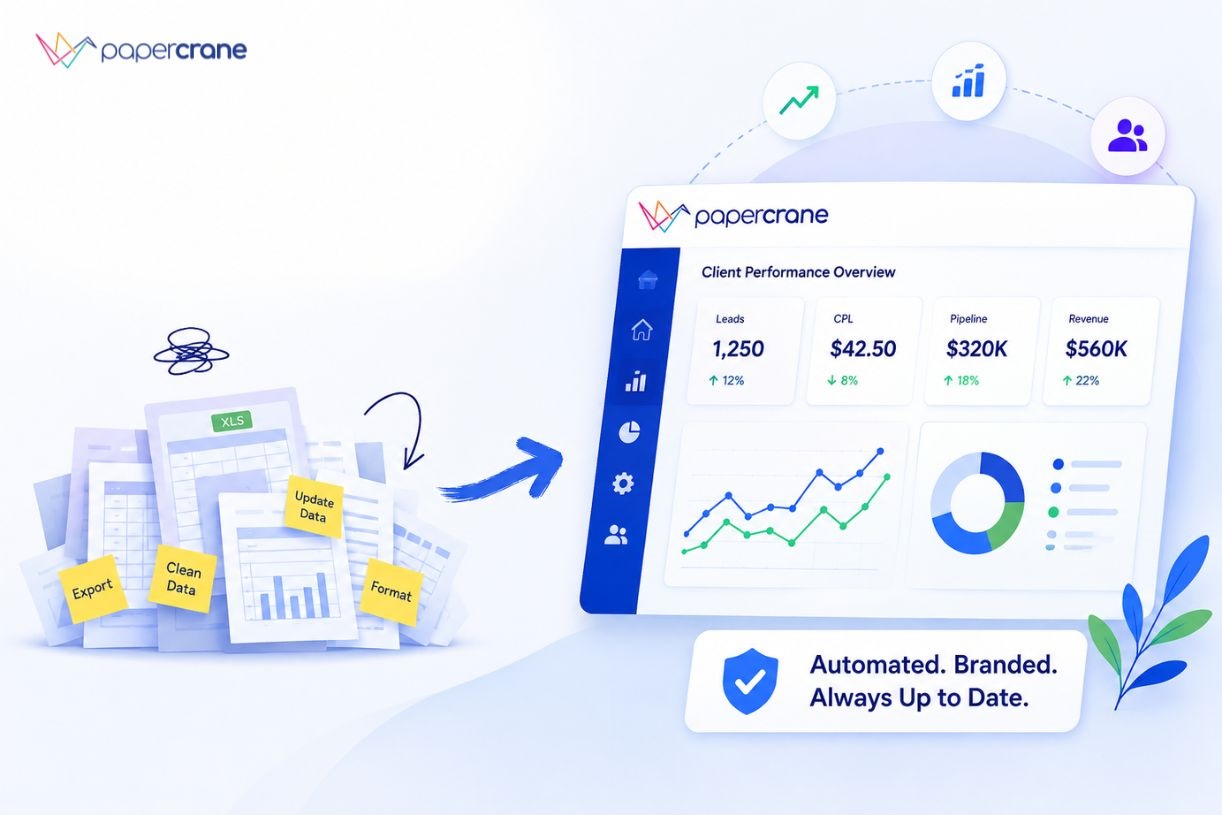
White Label Dashboard for Agencies: Stop Rebuilding Client Reports
The client work is done. The reporting work shouldn’t take another few hours. Your team pulls Google Ads data, checks GA4, exports CRM numbers, updates charts, applies agency branding, writes the summary, and sends the report. Then the next client needs a different set of metrics. As your client list grows, reporting becomes another production […]
August 11, 2026
·
Tim Liu
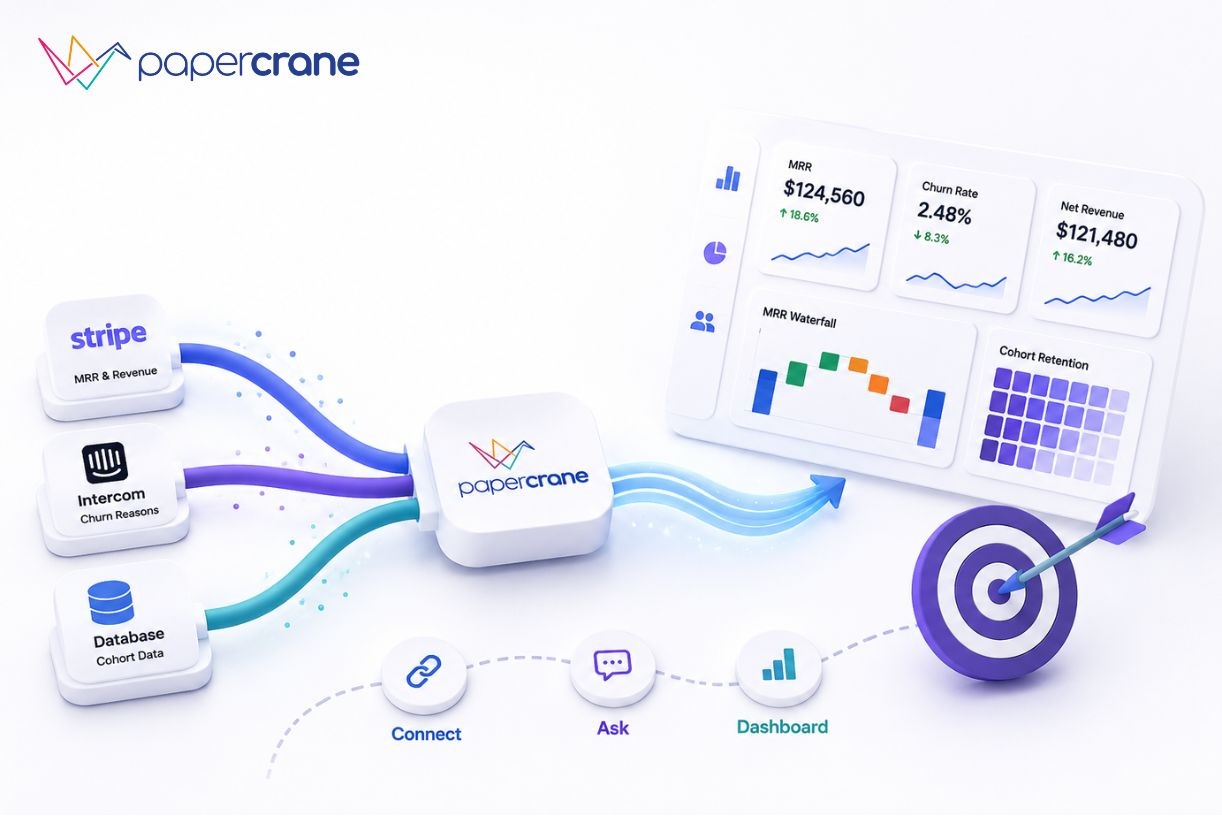
SaaS Dashboard: Track MRR, Churn and Cohorts Without an Analyst
A SaaS metrics dashboard is a single view of your most important numbers, MRR, churn, retention, and cohorts. It replaces spreadsheets, CSV exports, and one-off reports. Most founders don’t have one. They have pieces of one, scattered across different tools. Where Your Numbers Actually Live Right Now Your revenue data sits in Stripe. Your churn […]
August 7, 2026
·
Tim Liu
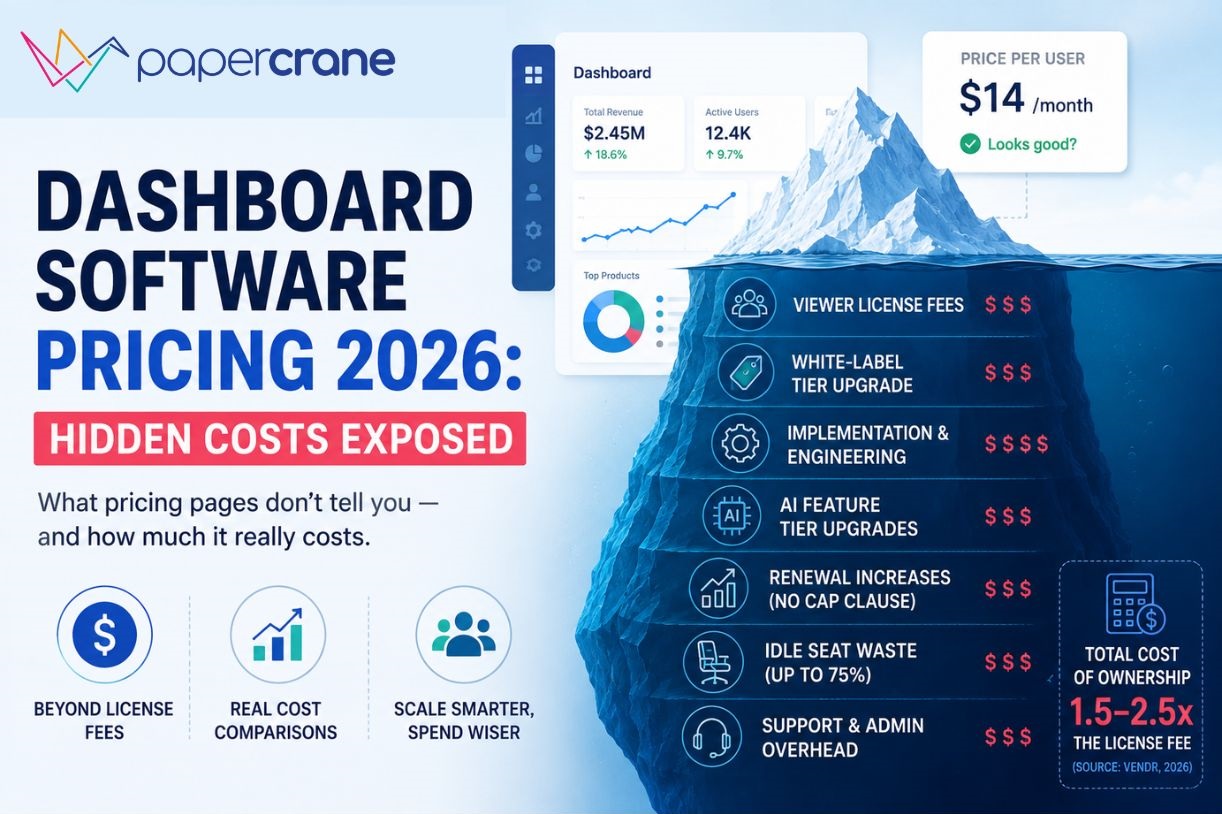
Dashboard Software Pricing 2026: Hidden Costs Exposed
A CFO signed a Tableau contract. The plan looked reasonable, a manageable per-user number. Six months in, between implementation consulting, data prep, training, and the support tier he didn’t know was optional, his team had spent well over what the license alone implied. Seventy-five percent of his employees still used Excel. That story isn’t an […]
July 28, 2026
·
Tim Liu
How to Build a MongoDB Dashboard Without Aggregation Pipelines
Your MongoDB database has millions of documents. Your stakeholders want a dashboard by Monday. Your developer is in the middle of a sprint. And the last time someone tried to build one, they spent three days tangled in aggregation pipelines ($group, $lookup, $unwind), only to end up with a broken chart that nobody understood. Sound […]
July 26, 2026
·
Tim Liu
PostgreSQL Dashboard in Minutes: No SQL Required
If your business stores data in PostgreSQL, you’re already sitting on valuable insights. The challenge is turning that data into reports your team can actually use. A PostgreSQL dashboard solves this by transforming raw database records into interactive charts, reports, and KPIs that help teams monitor performance in real time. Modern AI-powered dashboard builders take […]
July 23, 2026
·
Tim Liu

How Much Traffic Is Your GA4 Actually Missing? I Built a Dashboard to Find Out
Everyone knows GA4 does not track everything. Here is how to put Cloudflare and GA4 side by side on a live dashboard and measure the gap on your own site, in about ten minutes.
July 22, 2026
·
Tim Liu
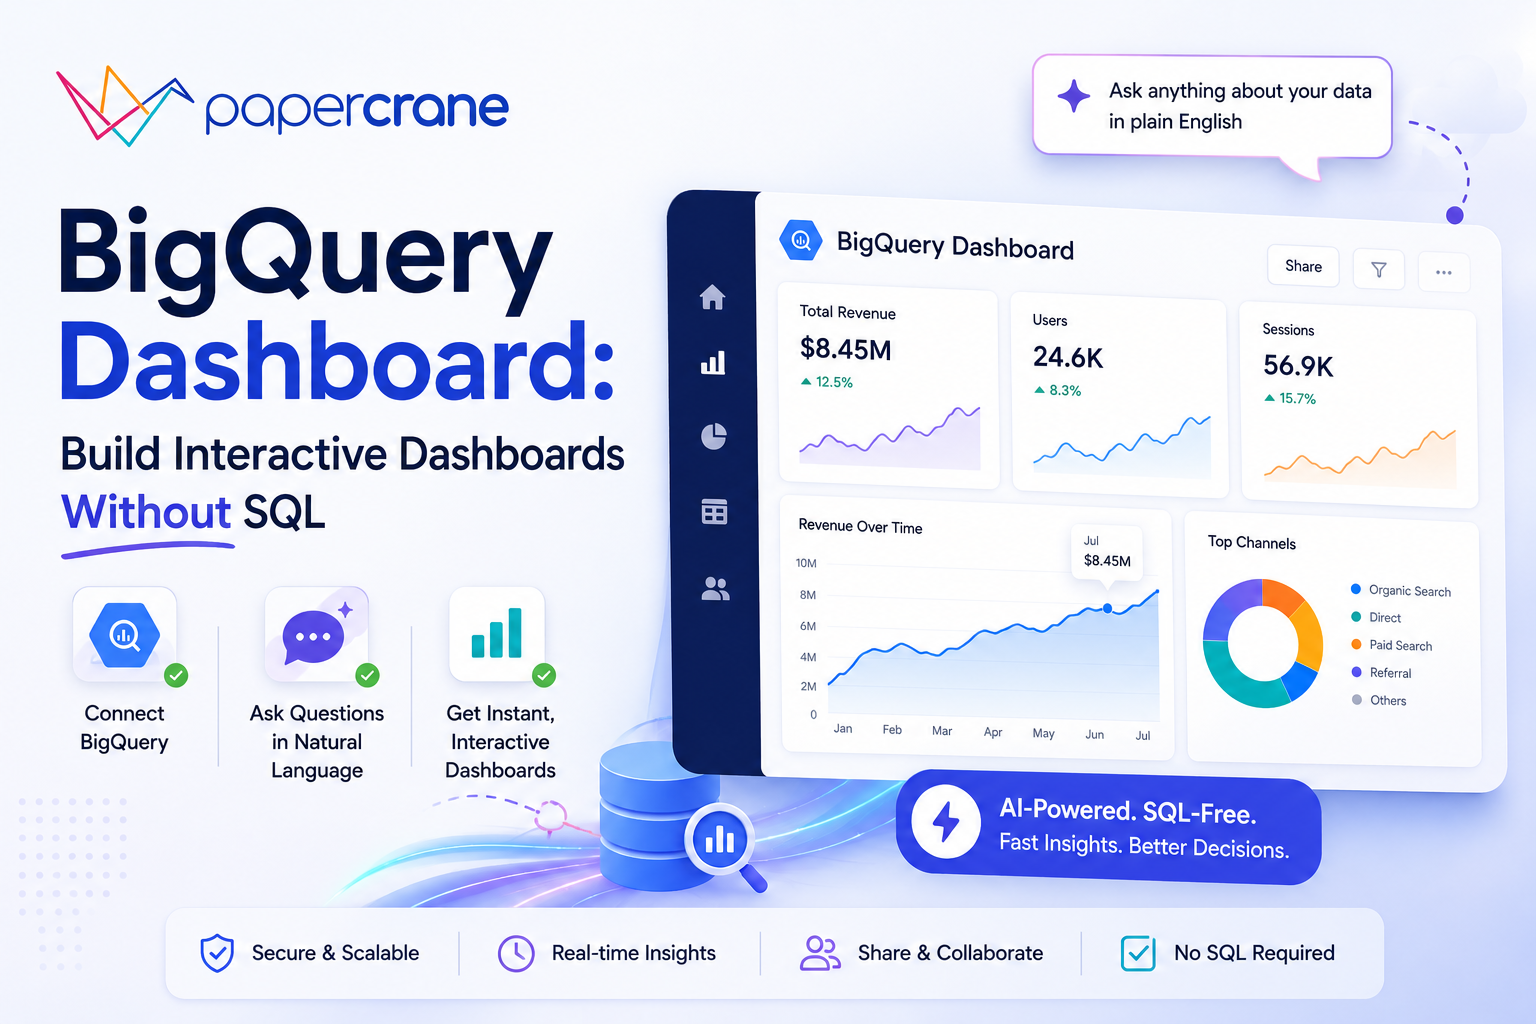
BigQuery Dashboard: Build Interactive Dashboards Without SQL
Your data is already in BigQuery, but getting answers from it is still a challenge. Teams spend hours writing SQL queries, switching between BI tools, or waiting for analysts to create reports. By the time a dashboard is ready, the opportunity to act may already be gone. A BigQuery dashboard transforms data stored in Google […]
July 21, 2026
·
Tim Liu

AI-Powered Analytics: How Businesses Turn Data Into Decisions Without Analysts
Businesses have more data than ever before. Marketing teams have campaign data. Sales teams have CRM data. Product teams have usage data. Finance teams have revenue data. Yet many companies still struggle to answer simple questions: The problem is not a lack of data. It’s turning data into decisions. Traditionally, businesses relied on analysts to […]
July 14, 2026
·
Tim Liu
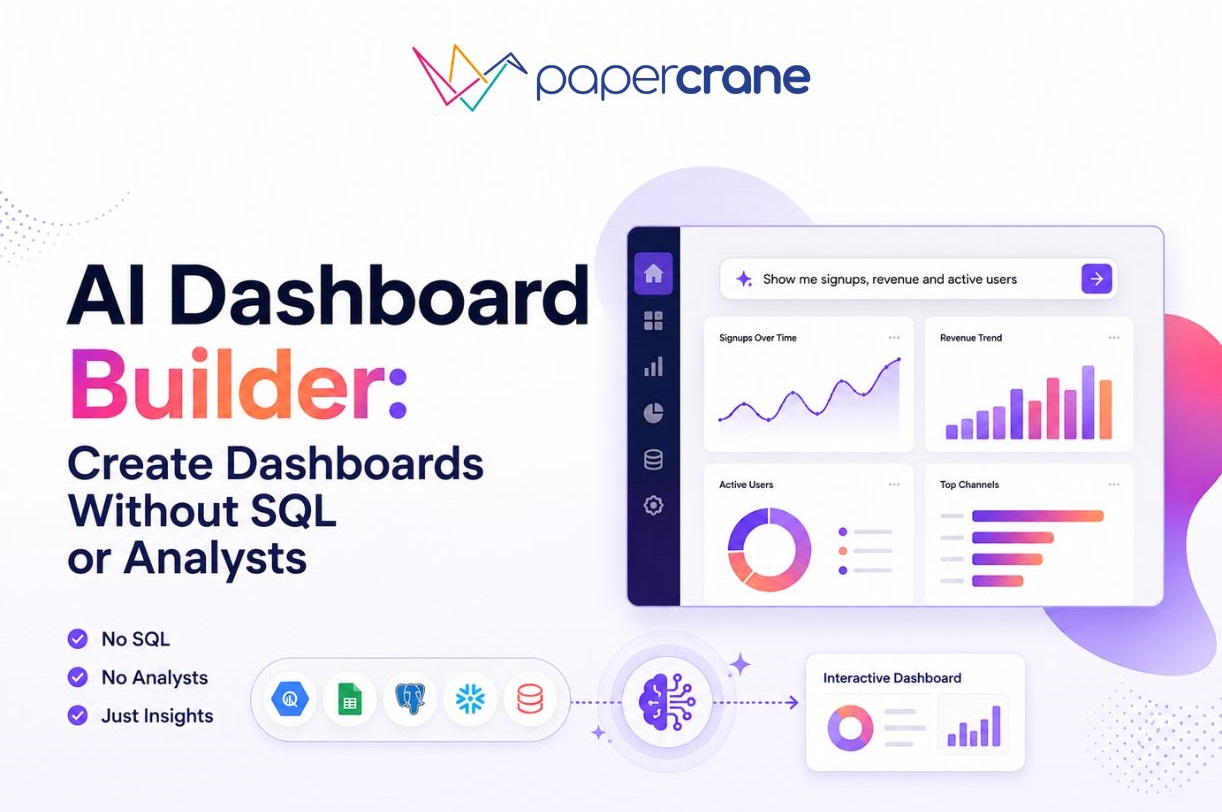
AI Dashboard Builder: Create Dashboards Without SQL or Analysts
Businesses rely on dashboards to track revenue, marketing performance, customer behavior, product usage, and key performance indicators. The problem is that building those dashboards has traditionally required analysts, SQL queries, business intelligence tools, and significant setup time. A simple reporting request often turns into days of work involving multiple people. Today, AI-powered dashboards builders are […]
July 9, 2026
·
Tim Liu

Today I’m launching papercrane-cli: a BI tool built for Claude Code
Every analytics vendor is bolting an AI copilot onto their dashboards. Power BI has one. Tableau has one. They all work the same way: the human drives the old tool, and the AI sits in a sidebar making suggestions. I went the opposite direction. I took the agent you already use and built the BI […]
July 8, 2026
·
Tim Liu
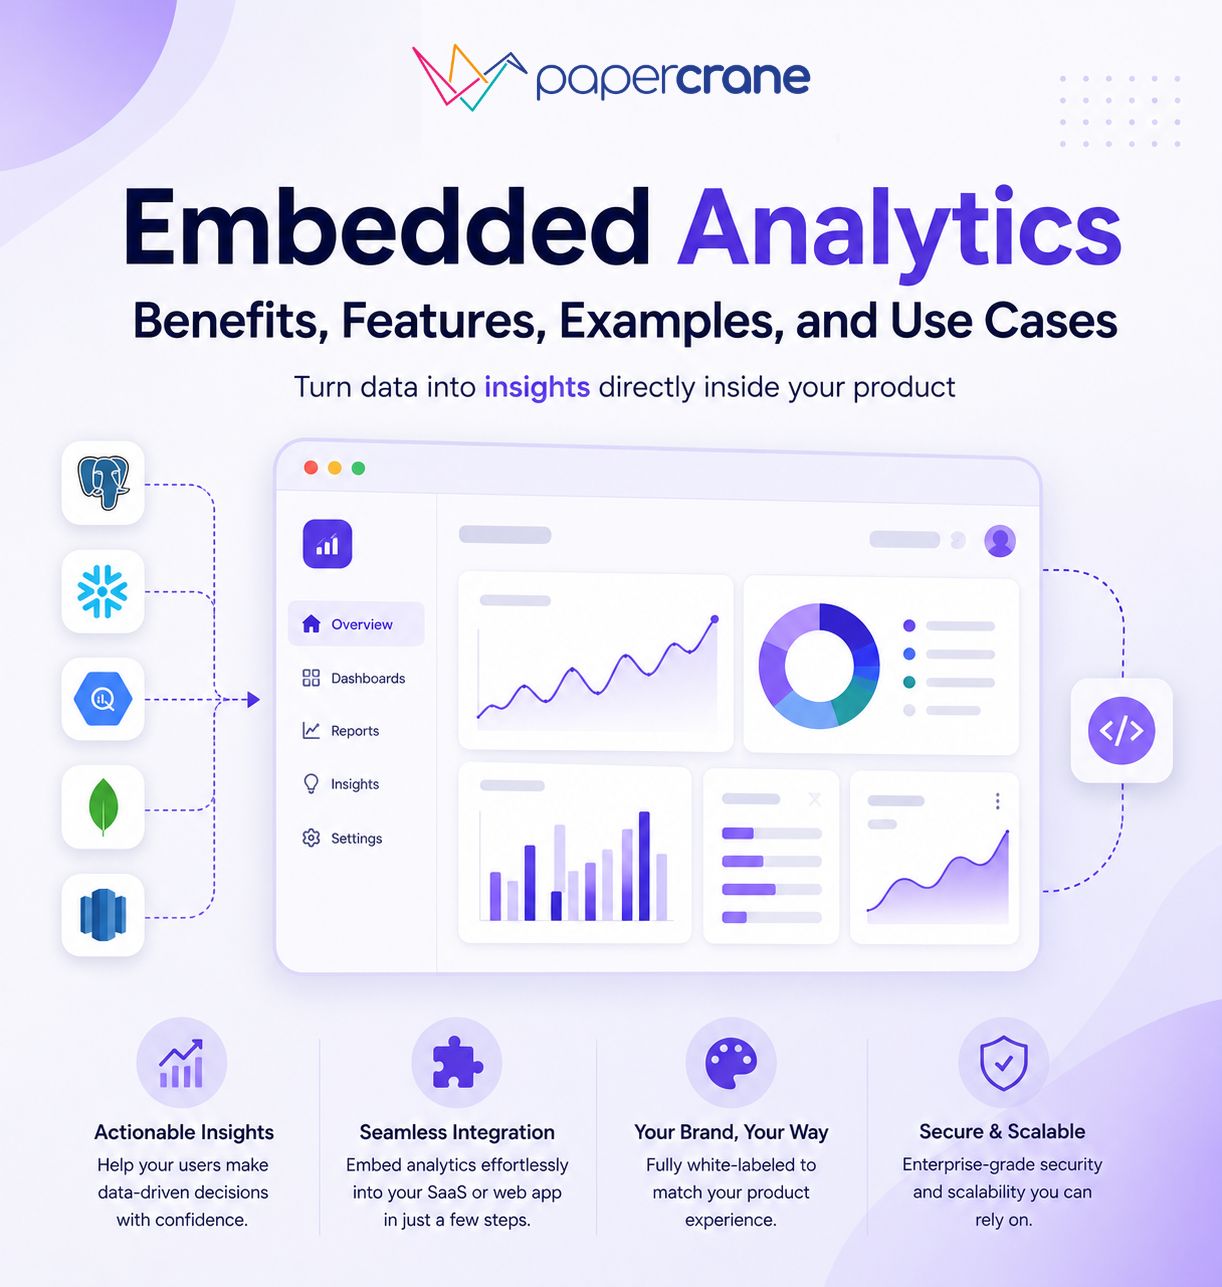
Embedded Analytics: Benefits, Features, Examples, and Use Cases
Businesses are generating more data than ever before. And the challenge is not collecting it. The challenge is making data available where people need it. Many organizations still rely on separate business intelligence tools and reporting platforms. Users must leave the application they are working in, log in to another system, find the correct dashboard, […]
June 16, 2026
·
Tim Liu